Podcast analytics dashboards have become very good at producing numbers.
The awkward part is deciding which number deserves a decision.
A show can have more downloads and fewer regular listeners. An episode can reach a large audience and lose most of it in the opening minutes. A podcast can hit a chart because of a short campaign while the underlying audience stays flat.
None of those numbers is wrong. They are answering different questions.
The useful approach is to start with the question, then choose the metric—not the other way round.
Start with four questions
Most podcast growth conversations fit into one of these:
- Reach: How many people did we get in front of?
- Acquisition: How many tried the show?
- Engagement: Did they actually listen?
- Retention: Did they come back?
Revenue is a fifth question for commercial shows, but even then it helps to understand the four steps that create it.
You do not need every available metric in a weekly report. You need a small set that covers this journey.
1. Unique listeners
Unique listeners is the cleanest starting point for audience size on a platform.
It is more useful than raw plays when you want to answer “how many people did we reach?” because the same person can generate multiple plays. Definitions vary by platform and time window, so label the source and period:
4,820 Apple Podcasts listeners, last 28 days
is much better than:
4,820 listeners
Do not add listener counts from several platforms unless you can deduplicate the people behind them. Someone who listens on both Apple and Spotify would otherwise count twice.
2. Downloads
Downloads remain important because podcasts are distributed through open RSS feeds and played in many apps.
A download is a request for the media file that meets the measurement rules used by your host or analytics provider. It is not proof that a person heard the whole episode. It is best treated as a consistent measure of delivery and reach, especially across apps where playback analytics are unavailable.
Use downloads to compare:
- episodes at the same number of days after release;
- the same show across consistent time windows;
- campaign periods with a normal baseline;
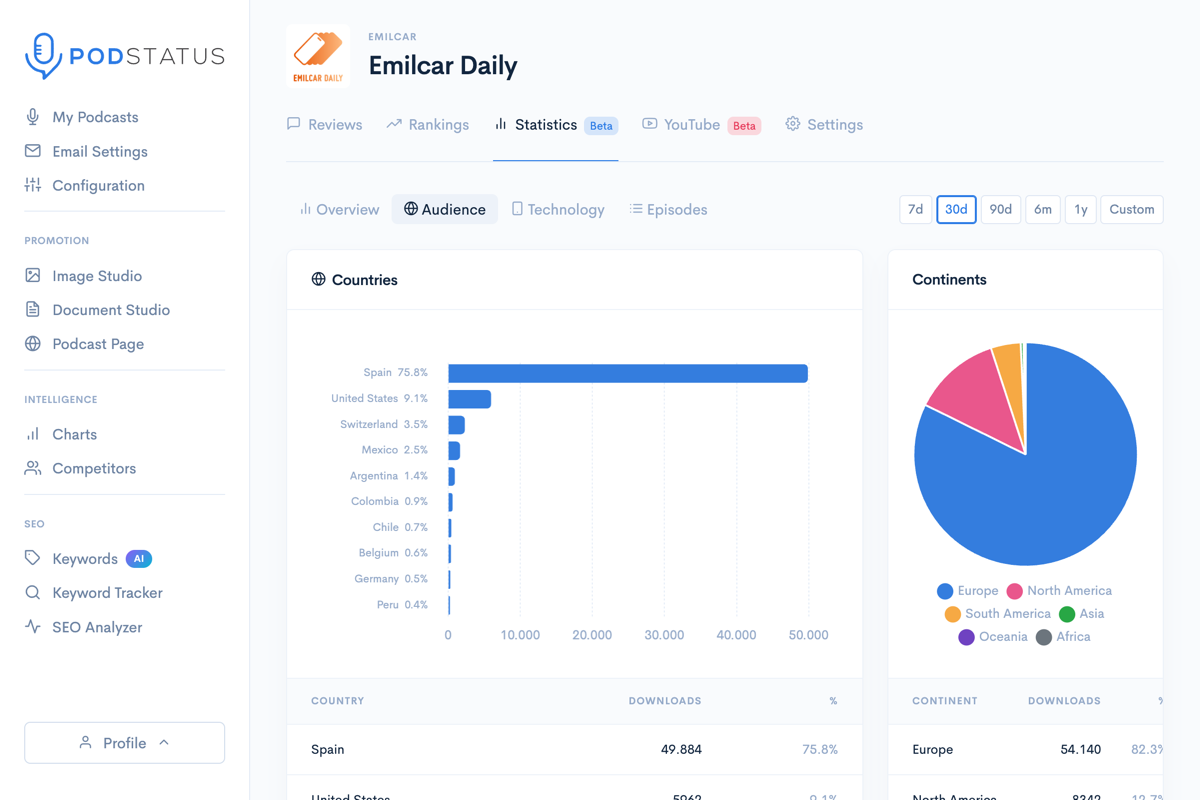
- geography and device patterns when the provider supports them.
Avoid comparing “downloads after 30 days” for one episode with “downloads after three days” for another. Newer episodes need an equal runway.
If you want an independent, privacy-conscious download source, Podstatus can bring OP3 statistics alongside rankings and other signals.
3. Plays or streams
Platforms use different language and thresholds.
Spotify, for example, distinguishes plays from streams. Its current engagement metric guide describes a play as active viewing or listening inferred from platform signals, while a stream is counted after 60 seconds.
That does not make one metric better. It means you must use the definition that matches the question:
- Use plays to understand active starts on Spotify.
- Use streams or qualified downloads for a more consistent consumption threshold.
- Do not silently compare a zero-second play definition with a 60-second stream definition.
Put the definition in a note once. Future reports will be much easier to trust.
4. Consumption or completion
Reach gets someone through the door. Consumption tells you whether the episode earned their time.
Apple Podcasts reports average consumption and engaged listeners. In Apple's listener analytics documentation, an engaged listener is someone who listened to at least 20 minutes or 40% of an episode.
Completion is especially useful when:
- testing a new intro;
- changing episode length;
- placing ads or recurring segments;
- comparing interview and solo formats;
- looking for a point where many listeners leave.
Be careful with very short episodes. A five-minute trailer and a 90-minute interview will create different listening behaviour. Compare similar formats or use both minutes listened and percentage consumed.
Also remember that average consumption can exceed 100% when listeners replay part or all of an episode. That is not necessarily a data error.
5. Followers
A listener tried an episode. A follower asked the platform to keep the relationship going.
That makes follower growth a useful bridge between acquisition and retention. Track:
- new followers per release;
- follower conversion from listeners or consumers, where available;
- follower growth after guest appearances and campaigns;
- changes in follower growth after improving the show page or trailer.
Total followers will usually move slowly. The weekly or monthly change is more actionable than staring at the lifetime number.
6. Returning listeners
For most independent shows, returning listeners are the closest thing to a health check.
A launch can buy or borrow attention. A returning listener chooses the show again.
Look at the share or number of people who return across releases, if your platform or host exposes it. When it is unavailable, use proxies:
- stable first-week downloads across consecutive episodes;
- follower growth plus consistent consumption;
- newsletter clicks from existing subscribers;
- repeated participation in listener surveys or communities.
No single proxy is perfect. A repeated pattern is still useful.
7. Impressions and discovery conversion
An impression means the show or episode was shown somewhere. It does not mean somebody listened.
Spotify's discovery analytics separates impressions from the actions that follow. That creates a useful funnel:
impression → show or episode interaction → consumption → follow
If impressions rise but consumption does not, the packaging may be the issue:
- the artwork is hard to read at thumbnail size;
- the title is vague;
- the episode promise is not clear;
- the topic is reaching the wrong audience.
If both impressions and consumption rise, distribution is working. If consumption rises without many impressions, a small but well-matched audience may be responding strongly.
This is why “more impressions” is not automatically the goal. Relevant impressions are.
8. Chart position
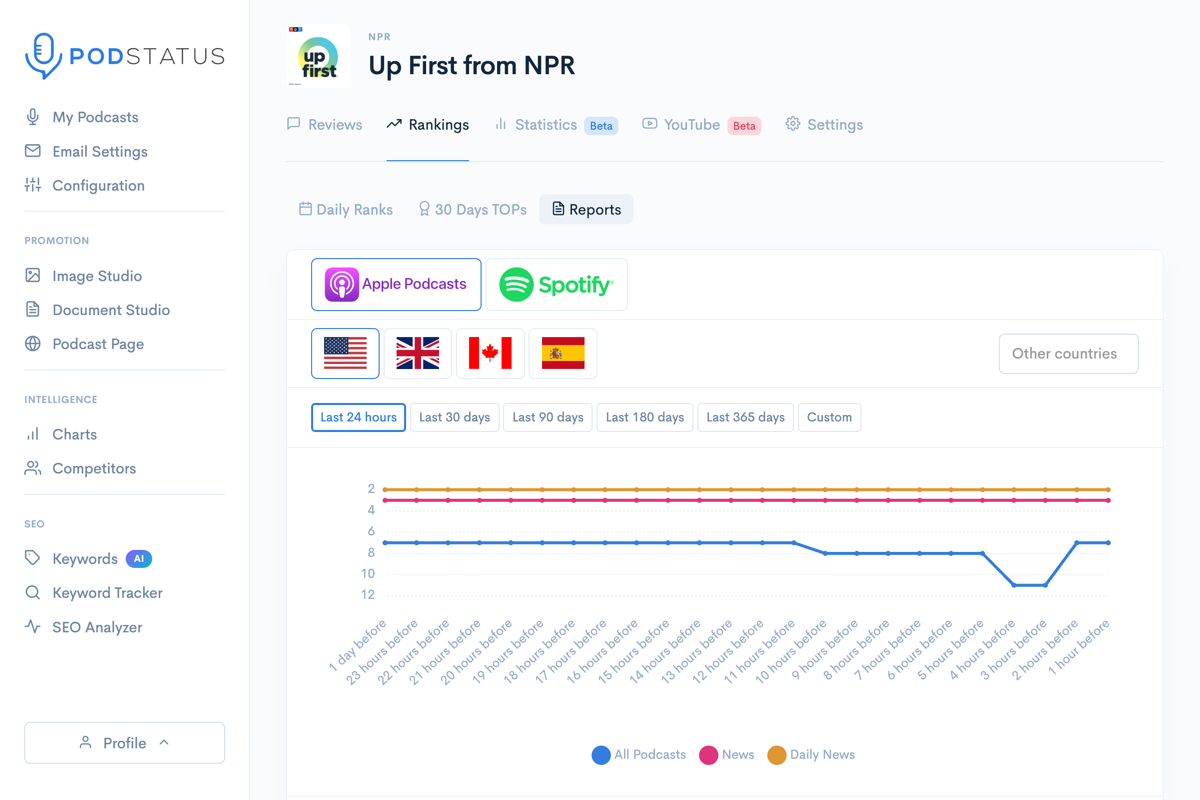
Chart rank is a discovery and momentum signal. It is not an audience total.
Track it with the full context:
- platform;
- country;
- category;
- position;
- date and time;
- release or campaign event.
A move from 80 to 25 can be meaningful even if downloads only rise modestly, particularly in a concentrated local market. It can also disappear at the next refresh. Pair rank with listeners, downloads, follows, and consumption before explaining why it happened.
You can check the current podcast charts for free and read how Apple and Spotify rankings work before interpreting the movement.
9. Reviews and ratings
Reviews are qualitative evidence, not just a star count.
The average rating can help a potential listener feel more confident. The text can tell you:
- which episode converted a casual listener;
- which guest or format people remember;
- what language listeners use to describe the value;
- recurring complaints worth fixing.
Apple says reviews do not directly change Charts or Search. Measure them as social proof and feedback, not as an algorithm hack.
Build a one-page podcast scorecard
For a weekly or monthly review, start with:
- Unique listeners: reach
- Qualified downloads or streams: consumption volume
- Average consumption or completion: engagement quality
- New followers: conversion to an ongoing relationship
- Returning listeners: retention
- Chart positions in priority markets: momentum
- Reviews received and recurring themes: qualitative feedback
Add revenue or subscriber metrics if they drive the business model.
For each metric, write the source, definition, window, and comparison. “Up 12%” means little if the previous period was half as long or included a launch.
Compare episodes fairly
The most useful episode view is often performance by days since release.
Compare every episode at day 7, day 30, or another fixed point. Apple Podcasts has a performance view designed around this idea. It avoids punishing a new episode simply because an older one has had months to accumulate listening.
Use the median episode as a baseline when one viral release would distort the average. Then ask:
- Which episodes beat the normal range?
- Did they reach more people, retain more people, or both?
- Was the topic, guest, title, length, or promotion different?
- Did the lift continue into the next release?
The last question separates a successful episode from a growing show.
A dashboard should end with a decision
Every recurring podcast report should make room for one line:
What will we do differently because of this?
Possible answers:
- Shorten the opening because the same drop appears in four episodes.
- Invite another guest from a topic cluster that brings returning listeners.
- Put more promotion behind a format with strong completion but low reach.
- Localize a campaign for a country where chart and listener momentum agree.
- Leave the format alone because the change is normal noise.
“Do nothing yet” is a valid answer when the evidence is weak.
Numbers are instruments, not grades
Podcast metrics work best when they help you notice a problem, test an idea, or choose where to spend effort. They work badly when every number becomes a public score for the creative team.
Choose a few definitions you trust. Compare like with like. Keep the chart milestone. Then make the next episode.
If your current data lives in several places, see how Podstatus brings rankings, reviews, keywords, OP3, YouTube, and other podcast analytics together.